As businesses add more and more tools to their technology stacks, each with its own set of analytics and reporting features, data overload becomes a serious potential problem. How can one gain actionable insights from so many different sources?
Just take a look at this common analytics approach to understanding conversions and/or revenue on a specific website:
- First, one needs to open Google Analytics, navigate to “Goals”, open the “Conversions” tab, and evaluate the tracked conversions.
- Unfortunately, Google Analytics, as useful as it is, doesn’t always provide the full picture, which means information from secondary tools like Mixpanel is needed.
- So one must then open Mixpanel (or a similar tool) and cobble the information gleaned from it together with data from Google Analytics to get an accurate conversions total.
Analytics are at the heart of competitive businesses, especially for those companies who are constantly innovating and breaking new ground. But evaluating data from multiple sources not only takes up a lot of time, it also leaves the door open to mistakes in reporting.
Fortunately, there’s a better way…
Here at Nightwatch, we’re constantly revising our KPIs monitoring approach to improve our laser focus, reduce data analysis noise, and help us better understand what’s actually going on in our business at any given time. Lately, our approach includes Google Data Studio.
In this article, we want to show you how you can use Google Data Studio to keep track of your company and push it forward. Let’s get started!
What is Google Data Studio?
To make sure we’re on the same page, we’ll start with a definition:
Google Data Studio is a free data visualization tool that allows users to illustrate their data in powerful reports. In other words, this tool allows you to see all your company’s important information in one convenient place.
Does your business use Google Analytics? What about marketing platforms like HubSpot, MailChimp, and AdRoll? The information from each of these tools (and many, many more!) can quickly be imported into Google Data Studio and assembled into easily digestible visual reports.
What Are the Benefits of Data Studio
Now that we have a general idea of what Google Data Studio is, we can talk about why it’s so beneficial to companies. There are three main reasons that we want to focus on:
All Your Data in One Place
Detailed analytics alone won’t help your business. If you can’t decode what the analytics are actually telling you about your company, you’re dead in the water. This problem is amplified by the fact that many business professionals rely on data from multiple sources, which creates a chaotic picture of what’s really happening inside an organization.
Google Data Studio solves this issue by allowing you to aggregate data from multiple sources into the same detailed and visually illustrated report.
When you can see everything at a single glance, you’ll be able to make better, more confident decisions regarding your company; always knowing that you have the right information on hand.
Become More Productive
There are plenty of data points you could track. But many times, an excess of information leads to poor productivity and even poorer results. Why?
It takes time to switch back and forth between multiple analytics dashboards and make sense of the numbers each one is giving you. Not to mention, when so many data points are available, it becomes easy to track the wrong ones.
Because Google Data Studio combines information from multiple sources into a single report, users can learn what they need to know in less time without worrying about extraneous details.
Boost Professionalism
Google Data Studio can be especially helpful for agencies because it allows them to appear more professional to their roster of clients — clients who want the bottom line, not a collection of confusing metrics from multiple sources.
With Google Data Studio, you can easily show your clients the impact your services are generating in one visual report that includes every key performance indicator (KPI).
Google Data Studio Connectors
So far, we’ve talked a lot about how Google Data Studio will allow you to import analytical data from multiple sources and display it in a single, illustrated report. While this is 100% true, some services are better equipped for this integration than others.
Common Connectors
Google Adwords, Facebook Ads, and Google Analytics are all common Google Data Studio connectors, which means these solutions will integrate seamlessly with the data visualization platform.
SEO Connector
Nightwatch.io is a popular connector, too, and happens to be one of the only SEO connectors currently available. It enables you to visualize your SEO ranking data directly on your Data Studio dashboard. You can learn more on how it works.
Your Other Options
But not every tool integrates perfectly with Google Data Studio. What are you supposed to do if your favorite software isn’t one of them? Fortunately, you have a few options:
Singer.io
Singer.io is a simple, composable open source ETL that will allow you to move data from any source to any destination. You can use it to send analytics information from each data platform you use to Google Data Studio. If your analytics tool of choice doesn’t directly integrate with Google Data Studio, Singer.io is a great option to connect platforms.
Stitch
Stitch is another great and reliable option for connecting analytics platforms to Google Data Studio. Unlike Singer.io, Stitch provides a managed service where you don’t need to take care of it. It has a free and paid plan — if you want access to advanced features. Some of Stitch’s customers include Peloton, InVision, Indiegogo, and many others.
Google Big Query
The final option we’ll mention is Google BigQuery, which can be used to replicate data from other analytics platforms and connect the resulting information to Google Data Studio. It’s easy to set up and because it’s made by Google, will integrate seamlessly with Data Studio. The cost of BigQuery depends on what you use it for.
Important KPIs to Track
Okay, it’s time to get into the nitty gritty details of analytics and discuss the important KPIs that your business should be tracking. Each KPI falls into one of five categories which are acquisition, activation, retention, referral, revenue.
We recommend these five metric categories because they follow the buyer’s journey. By monitoring the actions of your audience from new prospect to paying customer, you’ll be able to track the most important thing for your company: total revenue.
By only tracking these five categories, you’ll also guard yourself against information overload. Remember, one of the main benefits of Google Data Studio is the fact that is assimilates all useful information into one, easy to read report. You don’t want to negate this advantage by attempting to track 72 different data points.
Now, let’s discuss each of these important KPI categories in more detail:
Acquisition
Acquisition refers to the moment a potential customer first learns about your company and its products and/or services. This could be through search engine optimization, content creation (i.e. blog posts, explainer videos, etc.), your company’s social media presence, and more.
Specific KPIs in this first category include number of website visitors, number of blog readers, and your website’s bounce rate.
Activation
The activation stage of the buyer’s journey begins when a new user starts using your product and/or service and realizes its value. In other words, they have an “Aha!” moment. They don’t necessarily need to be a paying customer, though. They could simply be on a free trial.
Crucial KPIs in this category range from the number of new leads and email subscribers your company collects to the number of free trials currently in progress.
Retention
Next, we have the retention stage, which is all about retaining current customers for as long as possible. New users and customers are great. But if you can’t entice them to continue purchasing from your company, you probably won’t find much success.
You can track the retention category by analyzing KPIs such as the number of returning website visitors and customers, your brand’s email open rate, and more.
Referral
The best customers don’t just continue purchasing from your company, they also encourage others to do the same. If you can boost referrals, you’ll build an unstoppable engine for your company that will quickly propel it to success.
Track the referral category through the following KPIs: the number and frequency of shares and mentions on social media and the amount of backlinks your website receives.
Revenue
Lastly, we have the revenue category. You could ace every other facet of your company, but if you aren’t generating revenue, your company will be in trouble. Fortunately, revenue is a fairly easy metric to track.
Simply measure KPIs like new paying accounts and new product purchases.
Alternative KPI categories
Besides the AARRR separation we just outlined, you could also segment your data into a simplified dashboard that includes categories for:
- Overall Traffic
- SEO Performance
- Social Media
- PPC, and
- Leads and Revenue
While this approach doesn’t follow the buyer’s journey like the above approach does, it’s incredibly easy to setup and understand. For those new to Google Data Studio and analytics in general, this may be the preferred set up.
Setting Up Your KPIs
The next question is, how do you actually track the KPIs we discussed in the previous section? Every company is different so the exact answer to that question will vary depending on your brand, its target audience, and the products and/or services it sells.
Below is a simple template that you could use to track website performance. To use it, you’ll want to segment your reports into five different categories:
1. Traffic Overview
You’ll want to track all of the traffic your website gets from month to month and compare it to previous reports to make sure it’s going up. You’ll also want to have a look at your website’s most visited pages which can be found in Google Analytics. Finally, make sure to compare your site’s daily traffic numbers from organic search, social media, and pair advertising.
2. SEO Performance
Speaking of organic search, your website’s SEO performance should also be tracked. We suggest you generate reports that evaluate the average ranking and click potential for each of your keyword segments. You can split your keywords up as follows:
- Branded Keywords
- Non-Branded Keywords
- Blog Keywords
- Product Category Keywords
- Long-Tail Keywords
- High-Volume Keywords.
Using these six categories will give you a complete look at your site’s SEO performance.
3. Social Media Performance
Your company is on social media, right? Then it would behoove you to track the effectiveness of your efforts on these platforms using Google Data Studio as well. For Facebook and LinkedIn, have a look at the following metrics:
- Number of Published Facebook/LinkedIn Posts
- Number of Total Daily Interactions With Facebook/LinkedIn Page
- Average Number of Interactions Per Facebook/LinkedIn Post, and
- Number of Daily New Likes on Facebook/LinkedIn Page
For Twitter, the following data points should be tracked:
- Number of Tweets Per Day
- Number of Total Daily Interactions With Tweets
- Average Number of Interactions Per Tweet, and
- Number of Daily New Followers
4. Pay Per Click (PPC) Ads
What about your company’s PPC ads? Yes, these should definitely be tracked and visualized via Google Data Studio as well. The metrics you’ll want to pay the most attention to are:
- Spending Per Campaign: How much are your PPC ad campaigns costing your company? You, quite obviously, need to know this figure at all times.
- Clicks Per Campaign: Spend alone won’t tell you much of anything. You need to determine how many clicks your ad dollars are generating.
- CTA Per Campaign: Lastly, in the interest of generating clicks, you need to understand which of your PPC calls-to-action are performing best and why.
Google Data Studio will allow you to track each of these important metrics and help you determine how effective your PPC campaigns are.
5. Leads and Revenue
Lastly, we have leads and revenue. Ultimately, this is what all of your efforts in SEO, social media, and paid advertising should be generating. But you won’t know if you’re successful or not until you track:
- Leads Per Day: How many leads are your marketing efforts generating on a daily basis? The more, the merrier!
- Revenue Per Day: How much revenue are your marketing efforts producing every day? Leads are only beneficial if they become paying customers. Track revenue to make sure that a satisfactory portion of your leads end up making purchases.
- MRR On a Given Day: If you’re marketing a SaaS product, you’ll also want to track Monthly Recurring Revenue (MRR). When it comes to SaaS, one time sales won’t move the needle. Use Google Data Studio to track recurring revenue.
In the end, leads and revenue are the only things that matter. So doesn’t it make sense to track these metrics in Google Data Studio? We believe so.
Google Data Studio Dashboard Examples
There are endless possibilities when it comes to the way you set up your KPIs in Google Data Studio. Here are a few other inspiring examples:
Nightwatch
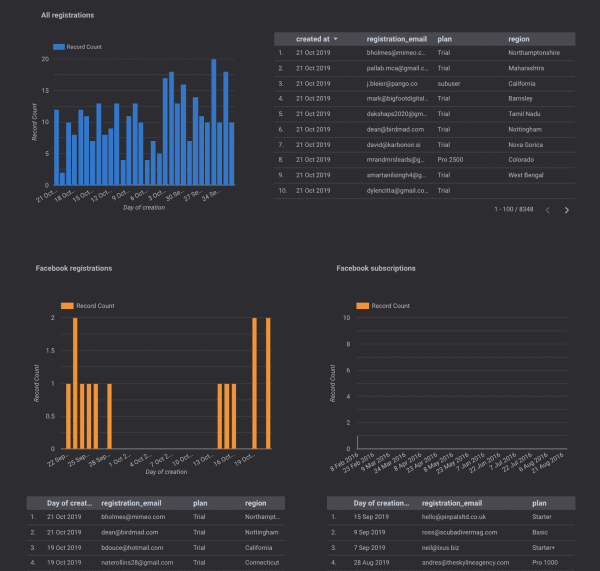
Here’s an example from our own website. If you look closely, you can see the amount of traffic we get from both Facebook and Google Ads as well as the number of subscriptions and registrations from each source.
The Next Ad
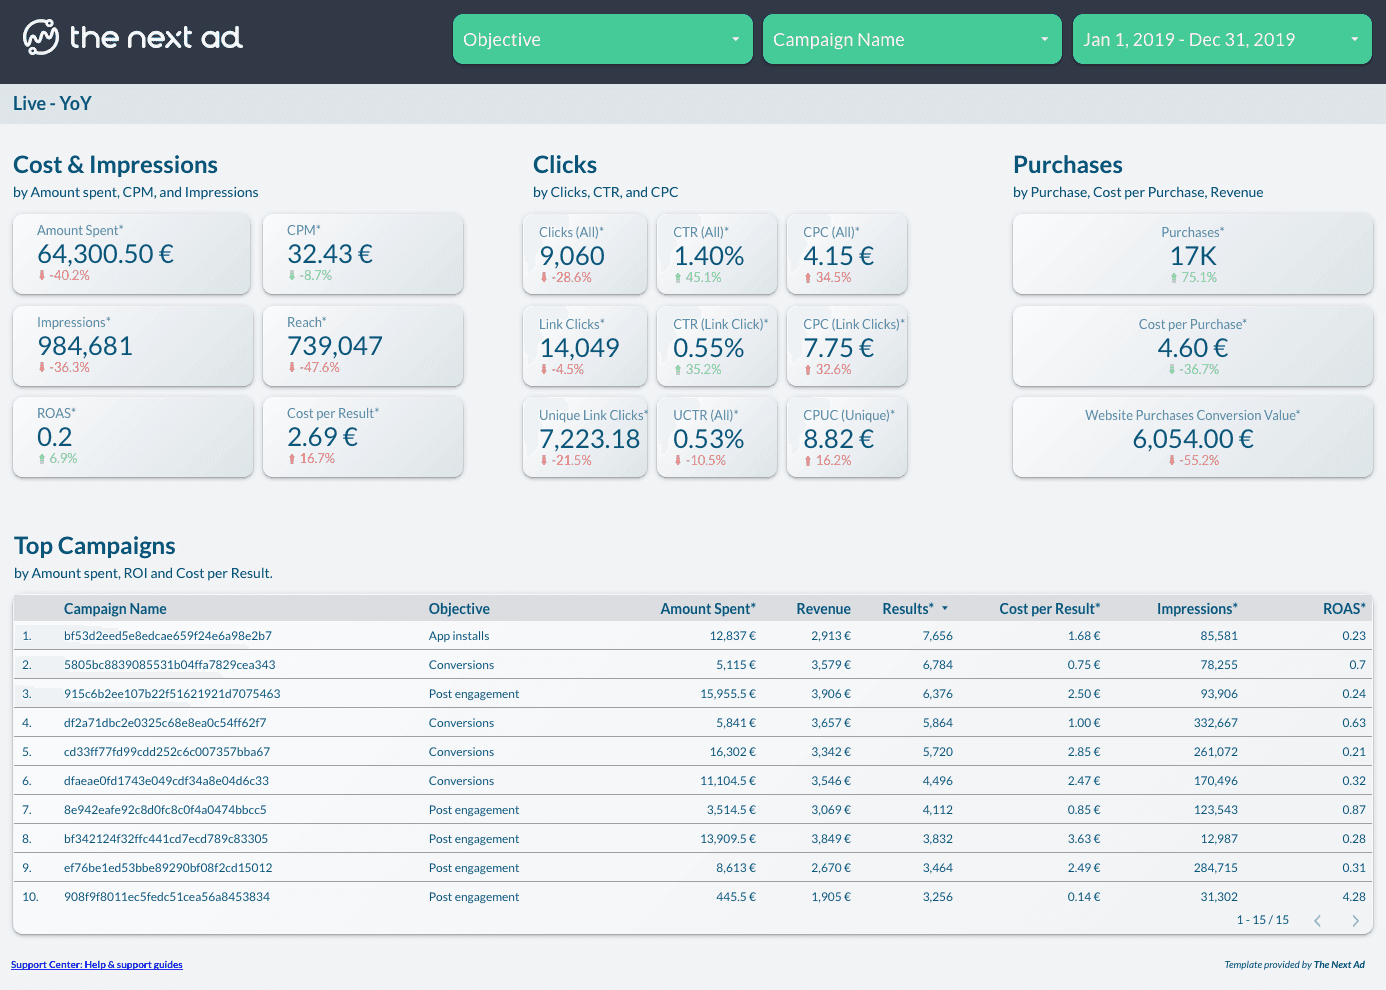
Here’s another example from a company named The Next Ad. This Google Data Studio dashboard shows the company’s top campaigns as well as finer details like the total amount spent on ads, the cost per impression and click, and the number of purchases.
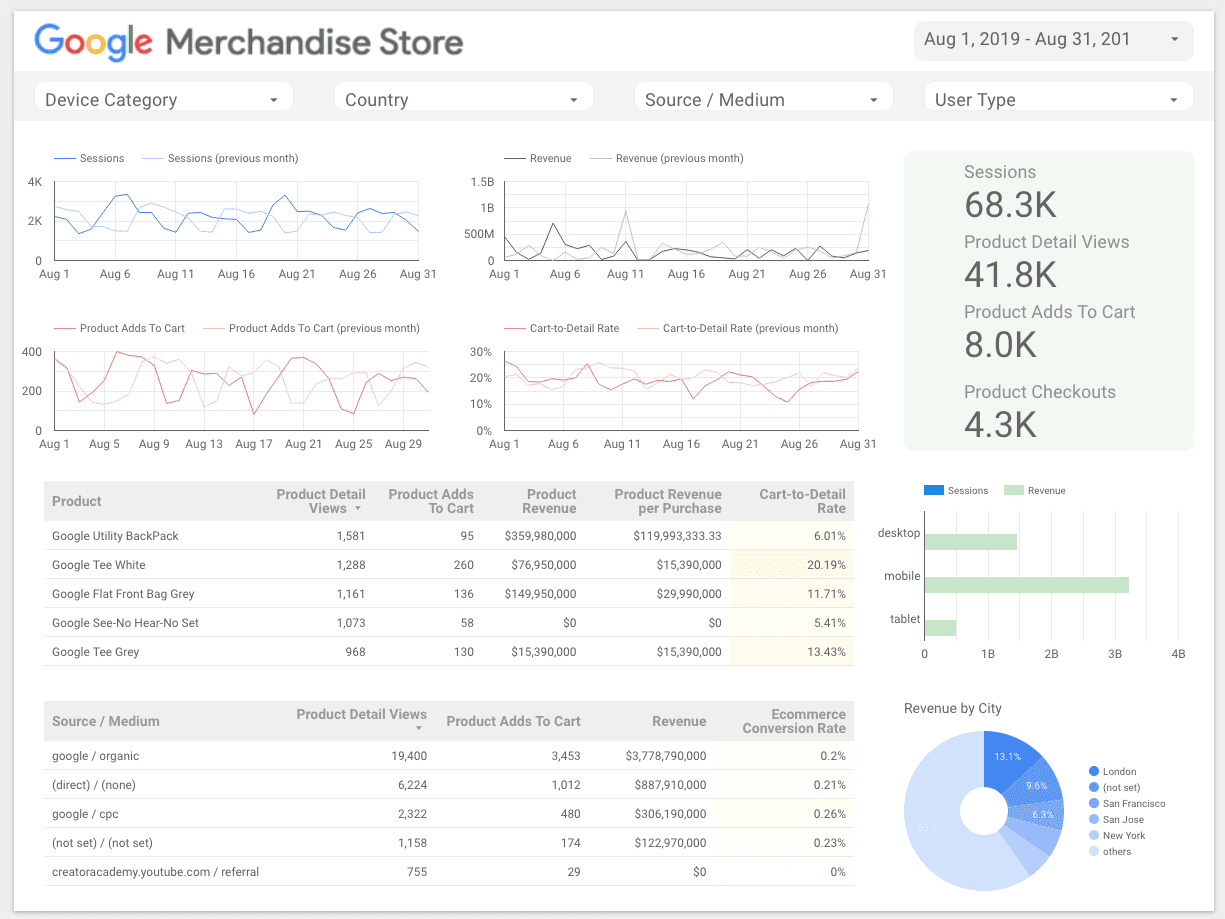
Google Merchandise Store
Finally, we have an example from the Google Merchandise Store. This Google Data Studio reports makes it easy to see important metrics like the number of website sessions, product adds to carts, and product checkouts within a 30-day period of time.
Quick Tip: Separate Your Dashboards
As you can see from the examples above, Google Data Studio is incredibly useful and makes it easy to turn boring data points into useful information. But before we sign off for today, we want to share a quick tip when setting up your own dashboards: separate them!
For example, we wouldn’t recommend creating a single dashboard for traffic and revenue. Instead, we suggest segmenting your dashboards into the following categories: Traffic, PPC, Social Media, SEO, and Revenue.
This approach will make it much easier to interpret your data and allow you to make better decisions regarding your company.
In Conclusion:
Google Data Studio will allow you to pull data from multiple sources and combine them into one illustrated and easy to understand report. This capability presents many benefits such as more accurate reporting, improved productivity, and better customer service (for agencies.)
Fortunately, using Google Data Studio is a piece of cake! If your chosen analytics software doesn’t integrate natively with Data Studio, you always use a tool like Singer.io, Stitch, or Google BigQuery to get the job done.
But remember, none of that matters if you aren’t tracking the right data (or too much of the right data) in the first place. Focus on these five KPI categories:
- Acquisition
- Activation
- Retention
- Referral
- Revenue
Then make sure to segment your dashboards so that you avoid information overload. Make sense? Perfect! Now get back out there and track those analytics the right way.
Looking for a powerful SEO tool to grow and optimize your search visibility and supercharge your business? Then check out Nightwatch. Our platform is specifically designed for forward-thinking companies and web agencies. It’s also one of the few tools available as a SEO connector for Google Data Studio.
The best part? You can get started with Nightwatch today for free! Sign up for your free account and get access to all of our solution’s top features.
